
About the Noise JEM
Introduction
Noise-induced hearing loss is highly prevalent in the US, and noise is increasingly being linked to other non-auditory health effects such as cardiovascular disease, sleep disturbance, and stress. However, our knowledge of noise exposures associated with many US occupations is lacking. To address this issue, we used existing resources to develop a first-of-its-kind Job Exposure Matrix (JEM) for noise which allow users to estimate workplace noise exposures on a national scale. With funding from the National Institute for Occupational Safety and Health (NIOSH), we used existing noise measurement data obtained from a wide variety of regulatory and research agencies, the published literature, and industry sources to efficiently create the JEM, which contains estimates of mean Time-Weighted Average (TWA) noise exposure levels (in A-weighted decibels, dBA) coded to standardized industry and occupation classifications. We also created estimates of the prevalence of overexposure to noise. We collected a total of 989,179 valid noise measurements representing 274 NAICS and 430 SOC codes. The measurement data span nearly six decades, with the first data available from the 1960s, and the most recent data from 2015. We used the results from the noise JEM to develop a web-based tool which allows epidemiologists, occupational hygienists, occupational health practitioners and other relevant stakeholders to access the noise exposure estimates. While individual facilities still need to be assessed for noise exposure, our JEM provides a tool that can be used to inform targeted hearing loss prevention research and intervention efforts, for benchmarking, and for efficient epidemiological exposure assessment.
What the JEM shows
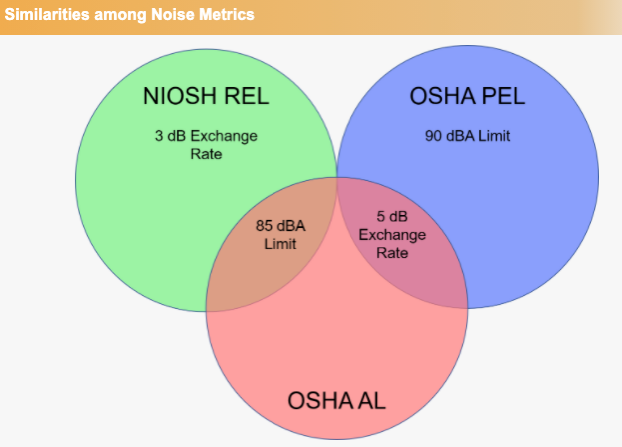
The data we collected include measurements made according to three different exposure standards, shown in the figure below. These are: 1) the Occupational Safety and Health Administration (OSHA) 90 dBA TWA Permissible Exposure Limit (PEL); 2) the OSHA 85 dBA TWA Action Level (AL); and 3) the NIOSH 85 dBA TWA Recommended Exposure Limit (REL).
As shown in the heat map below, the JEM data indicate that average noise levels in US industries generally declined from the 1960s through 2015.
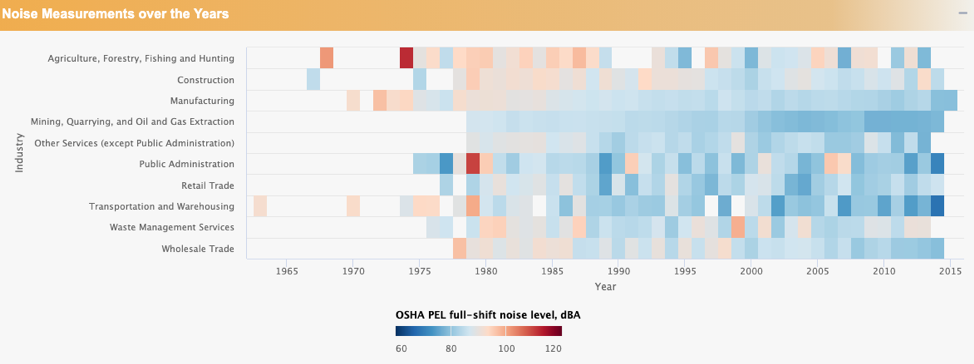
However, while average levels have gone down, in many industries exposures to harmful levels of noise are still common. For example, the average TWA noise level in the Logging industry between 2006 and 2013 was 93.6 dBA, well above the 90 dBA OSHA PEL, and 77% of measurements exceeded the OSHA PEL. Similarly, the average TWA noise level for the Road, Bridge, and Highway Construction industry during the same period was 89.7 dBA, just below the PEL, but 53% of measurements were above the PEL. Our JEM can be used to identify industries and jobs where noise exposures have declined to levels at which workers’ risk of hearing loss is minimal, but also industries and jobs where additional efforts are need to reduce exposures and hearing loss risk.
How to use the JEM website
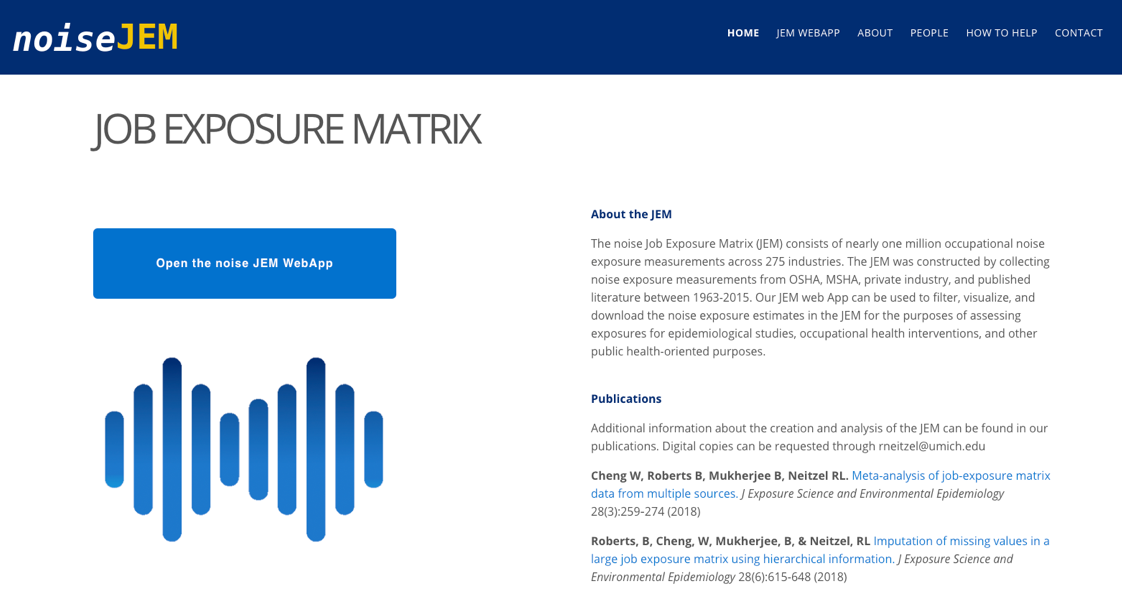
We have designed the JEM website to be easily accessible to anyone with an internet connection and a computer. First, visit our home page and click on the “Open the noise JEM WebApp” button:
After the WebApp loads, follow the onscreen instructions to get an overview of the dataset, search for particular industries or jobs, or learn more about the definitions of terms associated with the Noise JEM:
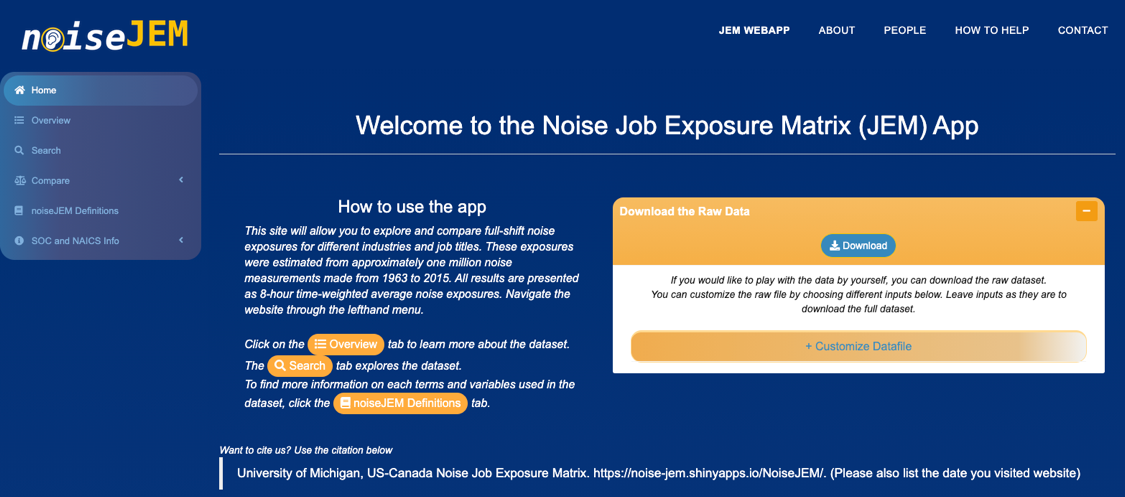
You can also choose to download the entire dataset if you wish to do your own analyses of our data.
If you opt to search for a particular industry or job, the results for all noise measurements made in that industry or job will be displayed. Here is an example of the results from a search for the Coal Mining industry:
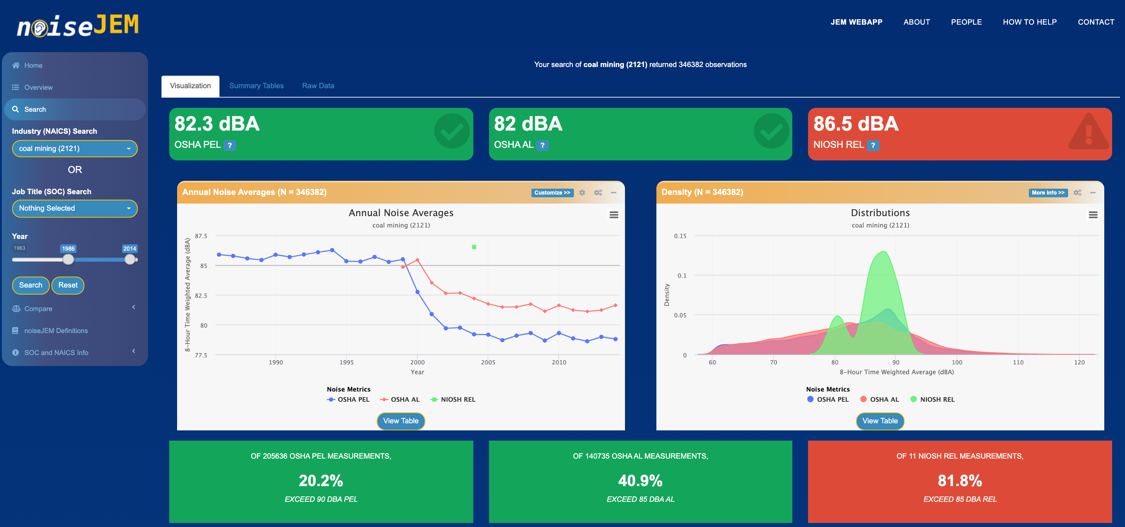
These results show the average noise level measured according to the OSHA PEL, OSHA AL, and NIOSH REL across the top of the screen, and are color-coded, with green indicating levels below the relevant exposure limit, and red indicating levels above the relevant limit. Trends in the measured levels over time are displayed in the center of the screen, along with the statistical distribution of the measurements. Finally, the percentage of measurements that exceed each of the three exposure limits is shown at the bottom of the screen, with green indicating smaller percentages exceeding the relevant limit, and red indicating a larger percentage.
We encourage you to use this tool and give your feedback in the comment section below. please let us know your thoughts in the comment section below.
This study was funded by grant R21OH0 10482 from the National Institute for Occupational Safety and Health (NIOSH)